

Gold – strong two-day pullback cracks $5000 support but larger bulls remain in play
Gold dipped briefly below key $5000 support on Friday, in extension of spectacular drop of more than $600 in just two days.
As I signalled in yesterday’s comment, risk of pullback has increased after the yellow metal’s price advanced for nine consecutive days and accelerated after break of $5000 barrier.
Initial dip from $5600 to $5500 looked like simple price adjustment that we have seen in previous sessions, before the news that new Fed Chair’s stance on monetary policy might be more hawkish than expected, sparked strong sell-off, but a number of comments in social media suggesting that intervention may be behind this move, should not be ignored.
Although Thursday’s long-legged daily Doji candle (after sharp fall found footstep at $5100 and subsequent bounce) signalled strong indecision and left the door open for both positive and negative scenarios, fresh acceleration lower on Friday confirmed that correction from new record high extends.
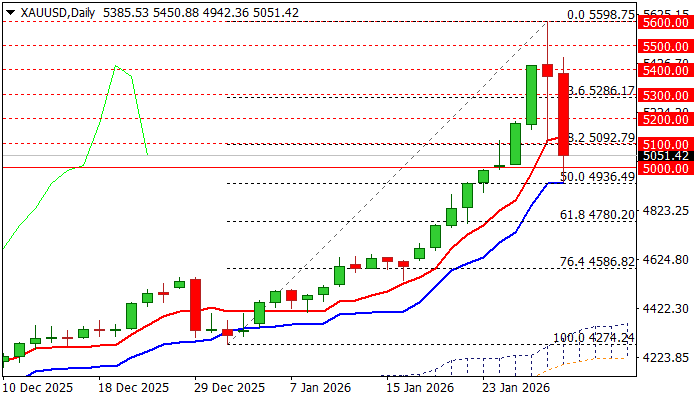
Today’s violation of key psychological support at $5000 (dips found support at next very significant level at $4936 – 50% retracement of $4274/$5598 upleg, reinforced by daily Kijun-sen) added to negative outlook.
The fact that it is the last day of the week and the last day of the month, as well as calmer tones from the Middle East region (signals that Trump might be shifting towards talks with Iran rather than military action) may add pressure on gold price.
Technical picture on daily chart shows strong loss of positive momentum and RSI emerging from overbought territory, though MAs are still in bullish configuration and partially counter negative impact.
Gold is still on track for significant monthly gain, but completion of reversal pattern on daily chart and formation of Gravestone Doji candle on weekly chart (bearish reversal candlestick pattern) keeps the downside vulnerable.
Weekly and monthly close above $5000 would keep in play scenario of a healthy correction of larger uptrend before bulls regain control.
Res: 5100; 5157; 5200; 5286
Sup: 5000; 4936; 4900; 4780