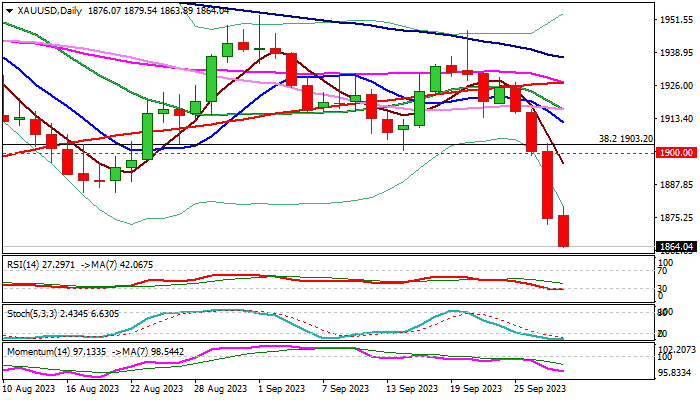
Gold is trading at six-month low after losing 3% in past four sessions
Gold price fell to the lowest in over six months on Thursday, extending steep fall into fourth consecutive day and generating a total loss of nearly 3% in just four days.
The metal came under increased pressure from growing expectations for more Fed hikes and higher for longer rate outlook, which strongly hit demand for gold and prompted investors into dollar.
Two strong bearish signals were generated on loss of psychological $1900 support and $1884 (low of Aug 17), which added to scenario of bearish continuation, as the metal is in downtrend from $2080 (record high, posted on May 4).
Technical studies on daily chart are increasingly bearish, but overstretched, warning that bears may lose traction as the action approached the top of rising and thickening weekly cloud, which offers solid support ($1860).
Although there are no firmer signals of bounce yet, some corrective action should be anticipated in coming sessions.
Broken support at $1884 reverted to resistance which should ideally cap upticks sand guard upper pivots at $1900/03 (psychological / broken Fibo 38.2% of $1616/$2080 uptrend).
Res: 1879; 1884; 1892; 1900
Sup: 1860; 1848; 1812; 1804


