

USDCAD on roller-coaster after Canada’s jobs data, but bulls show signs of stall
The Canadian dollar fell sharply against its US counterpart on Friday, after release of downbeat Canada’s jobs data.
Employment figure showed strong fall in January (-88K vs forecasted -2K and previous month’s -2.4K); part time employment showed record fall by 137K in January vs 5.1K fall in December 2017, while unemployment rose to 5.9% in January vs expected 5.8%.
The Loonie fell to 1.2687, the lowest since late December, in immediate reaction to data, but quickly regained ground and managed to pare all losses, as increase in average hourly earnings by 3.3%, which marks the strongest figure in nearly two years, offset negative impact from other jobs data.
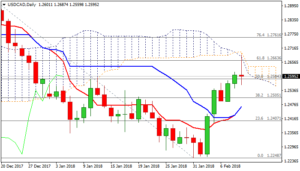
However, Canadian dollar remains at negative near-term path against the greenback, as USDCAD pair is holding in steep ascend from 1.2248 (31 Jan low), which has so far retraced over a half of 1.2920/1.2248 (19 Dec / 31 Jan) fall.
Improved daily technical studies offer more support, with 10/20SMA bull-cross and attempts to form another one on crossing of 10 over 30SMA. Strong bullish momentum also underpins recovery which was attracted by yesterday’s twist of daily Ichimoku cloud at 1.2699.
Near-term action after data release moved within within wide amplitude, but without clear direction signal as the rally was so far capped by daily Ichimoku cloud base (cloud turned lower and is widening after twist) and strong Fibonacci barrier at 1.2663 (Fibo 61.8% of 1.2920/1.2248 fall).
Also, strongly overbought slow stochastic on daily chart, warns of possible stall at this zone, which could result in extended consolidation or pullback.
Friday’s close will be closely watched for fresh signals, as daily Doji or red candle could be initial signal of bulls running out of steam.
Corrective easing would face solid support at 1.25 zone, which should ideally contain to keep near-term bulls intact and reduce risk of deeper pullback.
Bullish scenario requires close above Fibo 61.8% barrier at 1.2663 to generate firmer signal of bullish continuation and expose next target at 1.2764, provided by falling 200SMA.
Res: 1.2663; 1.2687; 1.2764; 1.2800
Sup: 1.2560; 1.2520; 1.2490; 1.2468