

Extended pullback tests important 20SMA support
WTI oil price holds in red for the third straight day and extends pullback from new 2019 high into third straight day.
Weekly chart initial signs of stall of larger uptrend, on bearish divergence on overbought weekly stochastic and Gravestone Doji forming on weekly chart.
Pullback was triggered by overbought conditions and profit-taking, as well as on expectations that OPEC will increase output to prevent shortage in oil supply on tightening US sanctions on Iran.
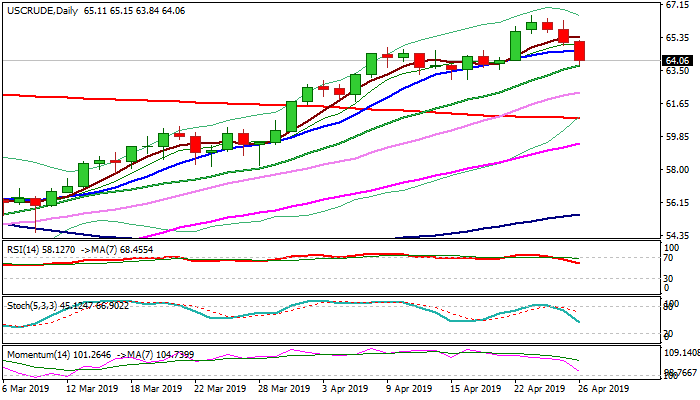
Dips tested support at $63.77 (rising 20SMA) as pullback so far looks as positioning for fresh advance, but break below 20SMA and 16 Apr higher low at $62.98 would signal stronger correction.
Res: 64.78; 65.15; 65.35; 66.27
Sup: 63.77; 63.36; 62.98; 62.37