

Recovery started to lose traction after hitting correction target
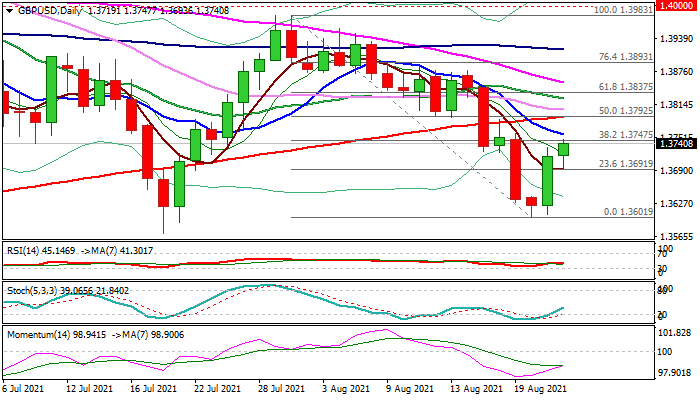
Last Friday’s hammer candle and Monday’s strong rebound (0.7% for the day) completed a reversal pattern on daily chart, but fresh gains started to show a signs of fatigue after hitting correction target at 1.3747 (Fibo 38.2% of 1.3983/1.3601 descend) on Tuesday.
Tuesday’s action is so far holding within a 50-pips range and shaped in a Doji candle, signaling indecision.
Daily studies are mixed as MA’s remain in full bearish setup while stochastic and momentum are in steep ascend, though the latter is still deeply in the negative territory.
Clear break of 1.3747 pivot would generate initial signal of recovery extension which would require a confirmation on break through significant barriers at 1.3792/96 (200DMA / base of falling thick daily cloud) to spark stronger correction.
Conversely, failure to clear 1.3745 Fibo barrier would keep the downside vulnerable and keep in play risk of retesting Aug low (1.3601).
Res: 1.3747; 1.3757; 1.3792; 1.3825
Sup: 1.3691; 1.3640; 1.3601; 1.3571