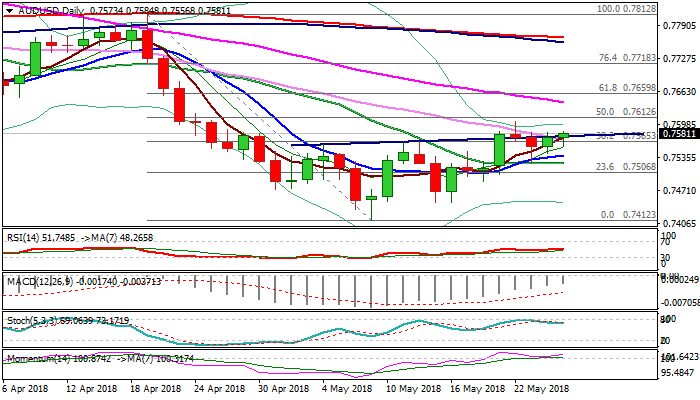


AUDUSD – bullish signal from inverse daily H&S but thick weekly cloud weighs
The Aussie dollar edged higher on Friday and retests highs of past two days at 0.7582, underpinned by formation of 5/30SMA bull-cross and keeping in play bullish bias on daily chart.
Strong bullish momentum also supports scenario as weekly close above cracked neckline of inverse H&S pattern would generate bullish signal for extension of recovery from 0.7412 (09 May low, the lowest since 02 Jun 2017).
Initial barrier lies at 0.7605 (22 May high), break of which would expose 0.7642 (falling 55SMA) and 0.7660 (Fibo 61.8% of 0.7812/0.7412 fall).
Thick weekly cloud (0.7641/0.7749) weighs and could limit stronger recovery attempts.
Conversely, softer tone could be expected on repeated close below falling 30SMA, while return below 20SMA (0.7523) will be bearish.
Res: 0.7605; 0.7642; 0.7660; 0.7682
Sup: 0.7572; 0.7539; 0.7523; 0.7502