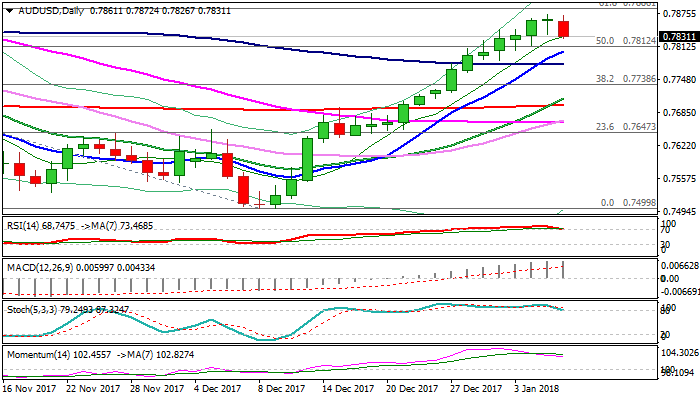


AUDUSD – Doji reversal signal is forming on daily chart
The Aussie trades in red on Monday after Friday’s trading ended in Doji, signaling that steep ascend from 0.7500 might be running out of steam.
Doji reversal pattern is forming on daily chart and risk of deeper pullback could be expected on violation of pivotal supports at 0.7816/03 (daily cloud top / rising 10SMA).
The notion is supported by daily RSI / slow stochastic attempts to emerge from overbought territory.
Confirmation of reversal could be expected on break below next pivot at 0.7785 (Fibo 38.2% of 0.7641/0.7874 upleg).
Overall bullish structure sees correction as buying opportunity for fresh advance and test of next pivotal barriers at 0.7886/0.7897 (Fibo 61.8% of 0.8124/0.7500 / 13 Oct high) break of which would generate bullish signal for extension of recovery leg from 0.7500 (08 Dec low).
Res: 0.7874; 0.7886; 0.7897; 0.7977
Sup: 0.7816; 0.7800; 0.7785; 0.7776