

Dollar index – near term action in slight bearish alignment ahead of this week’s key release – US PCE data
The dollar index edged lower on Monday, in attempts to end two-day congestion and resume the bear-leg from 104.85 (Feb 14 high).
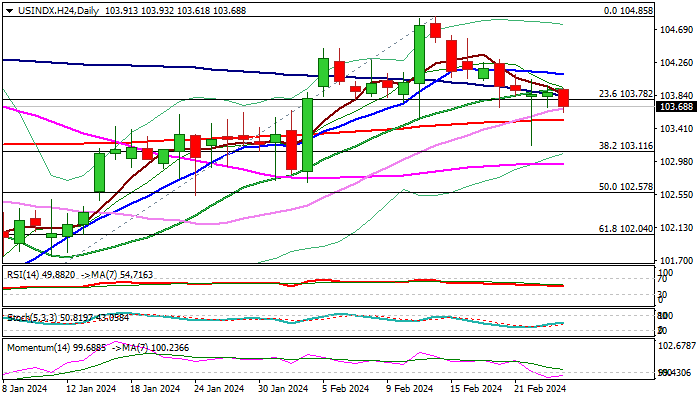
Strong downside rejection last Thursday, which left a long-tailed Doji candle and a bear-trap under Fibo 50% support and 200DMA (104.63/51 respectively) is still a kind of warning, as daily studies are conflicting (14-d momentum is in negative territory, MA’s are in mixed setup and stochastic is heading north) and lack clearer direction signal.
Also, volumes might be lower these days as traders await release of US PCE Index, Fed’s preferred inflation gauge on Thursday, which is expected to provide more information to policymakers in creating the monetary policy in coming months.
Recent strong expectations for early rate cuts have faded, with the latest narrative from Fed officials pointing to cautious approach and probably keeping the start of policy easing on hold for some time, given that the latest inflation rise might not be just transitory.
However, the Fed signaled rate cuts this year, but the beginning might be delayed and initially expected size of cuts in 2024 lower.
The policymakers stated that they need more evidence in inflation movements before making decision and Thursday’s data are likely to generate fresh signal for the dollar.
Pivotal supports lay at 103.51/11 (200DMA / Fibo 38.2% of 100.29/104.85) loss of which would signal bearish continuation.
Conversely, sustained break above 10DMA (104.11) would ease downside pressure and generate initial signal of an end of corrective phase from104.85
Res: 104.10; 104.42; 104.61; 104.85
Sup: 103.51; 103.11; 102.94; 102.57