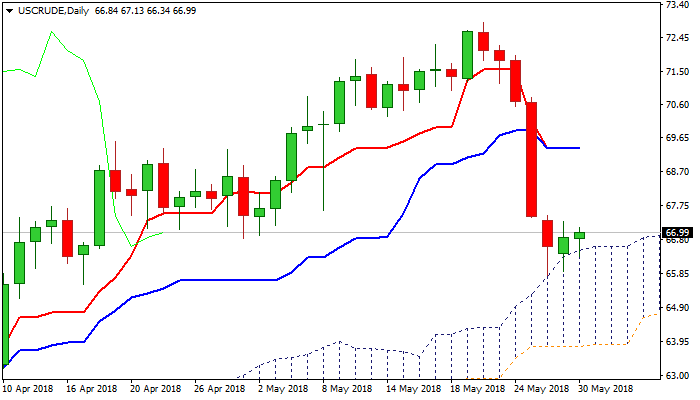


WTI OIL – basing attempt above rising daily cloud; weekly crude stocks data eyed for fresh signals
Basing attempts are seen on daily chart as oil price holds for the third straight day above the top of rising daily cloud which so far contained steep fall in past few days.
Profit-taking could boost the price and signal reversal on break above rising 55SMA ($67.20) and $67.47 (Fibo 23.6% of $72.89/$65.79) to expose next pivots at $68.22 (top of thick hourly cloud) and $68.50 (Fibo 38.2% of $72.89/$65.79 fall).
Slow stochastic is turning up in oversold territory and supports the notion, but south-heading momentum daily MA’s in bearish configuration maintain pressure and warn of recovery stall.
US weekly crude stocks data are in focus for fresh direction signals, after oil prices suffered heavy losses on fears of increase of output from main world oil producers.
Releases are delayed one day due to US holiday, with API data due later today, while EIA is going to release its weekly report on Thursday.
Bearish scenario requires final break and close below daily cloud top ($66.50) and also close below $66.04 (Fibo 61.8% of $61.80/$72.89) to generate strong bearish signal for continuation of fall from $72.89 (22 May low).
Res: 67.20; 67.49; 68.28; 68.50
Sup: 66.50; 66.04; 65.79; 65.55