

Bears extend after Wed’s 3.3% fall completed reversal pattern
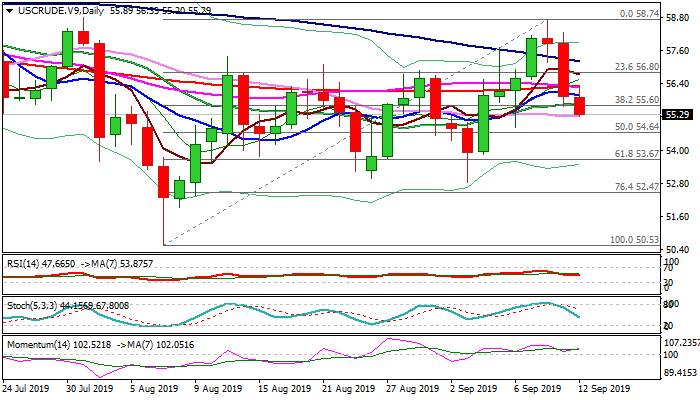
WTI oil price falls further Thursday and breaks below important Fibo support at $55.60 (38.2% of $50.53/$58.74).
Pullback from $58.74 high (10 Sep) extends after strong fall on Wednesday (oil was down 3.3% for the day) broke below a cluster of daily MA’s ($56.33/10 zone) and completed reversal pattern on daily chart, signaling deeper correction.
Near-term sentiment soured on OPEC’s downgrade of global oil demand forecasts for 2020 which offset positive signals from strong draw in US crude inventories and Saudi’s commitment to stick to production cut agreement.
Fresh bearish extension penetrated daily cloud and tests cloud base ($55.21), break of which would expose 50% retracement of $50.53/$58.74 ascend ($54.64).
Converged 200/55DMA’s ($56.31) are forming bear-cross, mark solid resistance, where upticks should be capped to keep fresh bulls in play.
Res: 55.60; 56.31; 56.80; 57.21
Sup: 55.20; 54.82; 54.64; 53.83