
SPOT GOLD rallies after correction but negative signals building on weekly chart
Spot Gold price jumped on Friday as dollar weakened on political uncertainty in the US.
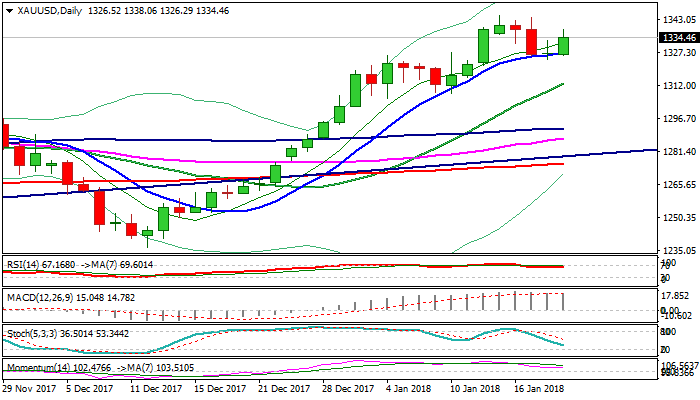
Reversal pattern was formed on daily chart following today’s bounce to $1338, which marks over 61.8% retracement of $1344/$1324 pullback and suggests that corrective phase might be over.
Underlying bulls look for further advance and retest of key short-term barrier at $1357 (08 Sep high), as the yellow metal maintains strong bullish sentiment on weak greenback.
However, risk of deeper pullback after uninterrupted rally in past five weeks exists, as weekly chart shows gold price on track for weekly close in Doji. This could signal that steep five-week rally is showing signs of indecision ahead of key $1357 barrier, which could result in correction.
Weekly slow stochastic turned sideways in deep overbought territory and supports scenario.
Ascending 10SMA which contained corrective pullback from $1344, now acts as initial support at $1327 and marks pivotal support zone with $1324 (correction low), loss of which would generate stronger bearish signal.
Res: 1338; 1344; 1350; 1357
Sup: 1327; 1324; 1319; 1315