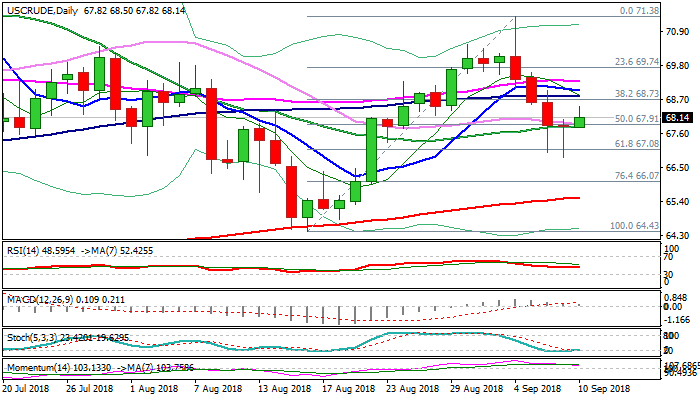


WTI – recovery attempts to form reversal pattern
WTI oil moved higher on Monday, bouncing to session high $68.50, recovery attempt from last Friday’s spike low at $66.85.
Repeated strong downside rejection and Friday’s long-tailed Doji, with today’s acceleration higher are signaling formation of reversal pattern on daily chart.
Technical studies support the notion as slow stochastic is forming bull-cross and reversing from oversold territory, while 10/30SMA’s are also attempting to form bull-cross.
But flat momentum and mixed daily MA’s so far weigh on the action.
Fundamentals are supportive, as persisting concerns on lower supply from Iran once new US sanctions start in November and drop in a number of US oil rigs, continue to underpin.
Fresh recovery attempts face a cluster of barriers, consisting of 100/10/55SMA’s at $68.81/$69.31, with sustained break here needed to confirm reversal and shift near-term focus higher.
Otherwise, the downside would remain vulnerable if recovery shows signs of stall.
Res: 68.50; 68.81; 69.00; 69.31
Sup: 67.82; 67.31; 67.08; 66.85