Gold falls below $2000 after US inflation data
Gold price fell sharply after US data showed January inflation increased above expectations and cooled hopes for early start of Fed rate cuts, which made the dollar more attractive and deflated demand for safe haven bullion.
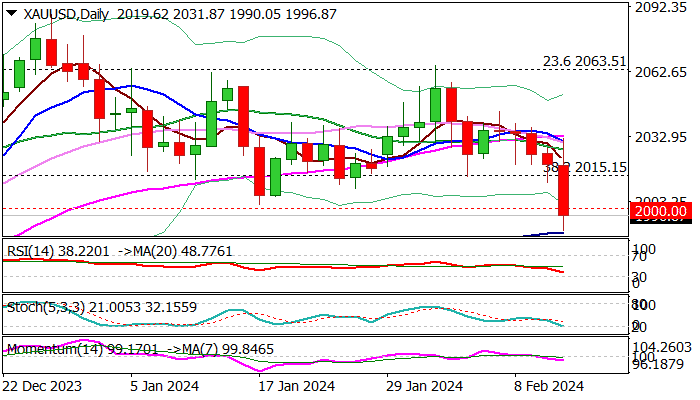
The price fell below psychological $2000 level for the first time in two months, but dip was so far contained by 100DMA ($1989).
The structure on daily chart weakened as moving averages (10/20/55DMA’s) turned to bearish setup and negative momentum is rising however, fresh bears still require more work to the downside to verify bearish signal and open way for deeper fall.
Daily close below $2000 is seen as minimum requirement, followed by clear break below 100DMA, with extension below pivotal supports at $1976/65 (50% retracement of $1810/$2141 / 200DMA) to bring bears fully in play.
Meanwhile, oversold conditions may slow bears, with upticks to ideally stay under broken Fibo 38.2% ($2015) to keep bears in play.
Lift above $2015 to ease immediate downside risk but break above $2030 zone (converged 10/55DMA’s) to neutralize.
Res: 2000; 2015; 2030; 2044
Sup: 1989; 1976; 1965; 1950


