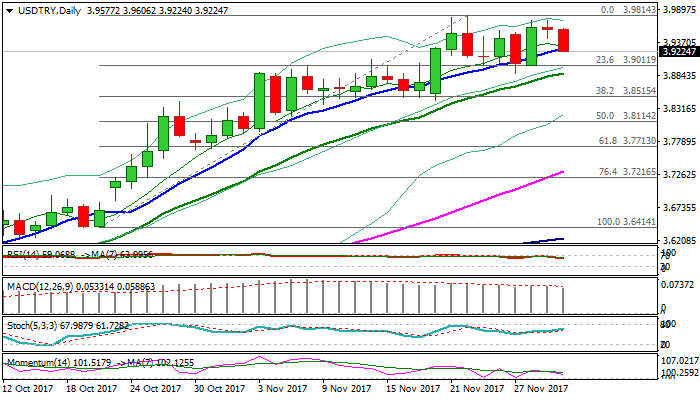

USDTRY – Doji reversal signal is forming on daily chart
Doji reversal pattern is forming on daily chart after yesterday’s action was repeatedly capped at 3.9729 and ended in Doji candle, with today’s bearish acceleration completing the pattern.
Fresh bears cracked initial support at 3.9280 (rising 10SMA) and threatening of extension towards strong support at 3.8884 (near-term congestion floor, reinforced by 20SMA).
Close below 10SMA is needed for initial bearish signal.
Stronger signal could be expected on break below 20SMA and could trigger extension towards next pivotal supports at 3.85 zone (Fibo 38.2% of 3.6414/3.9814 upleg / daily higher base).
Daily RSI is turning south after being repeatedly capped by overbought zone borderline and supports the notion.
Res: 3.9606; 3.9726; 3.9814; 4.0000
Sup: 3.9235; 3.9000; 3.8884; 3.8500